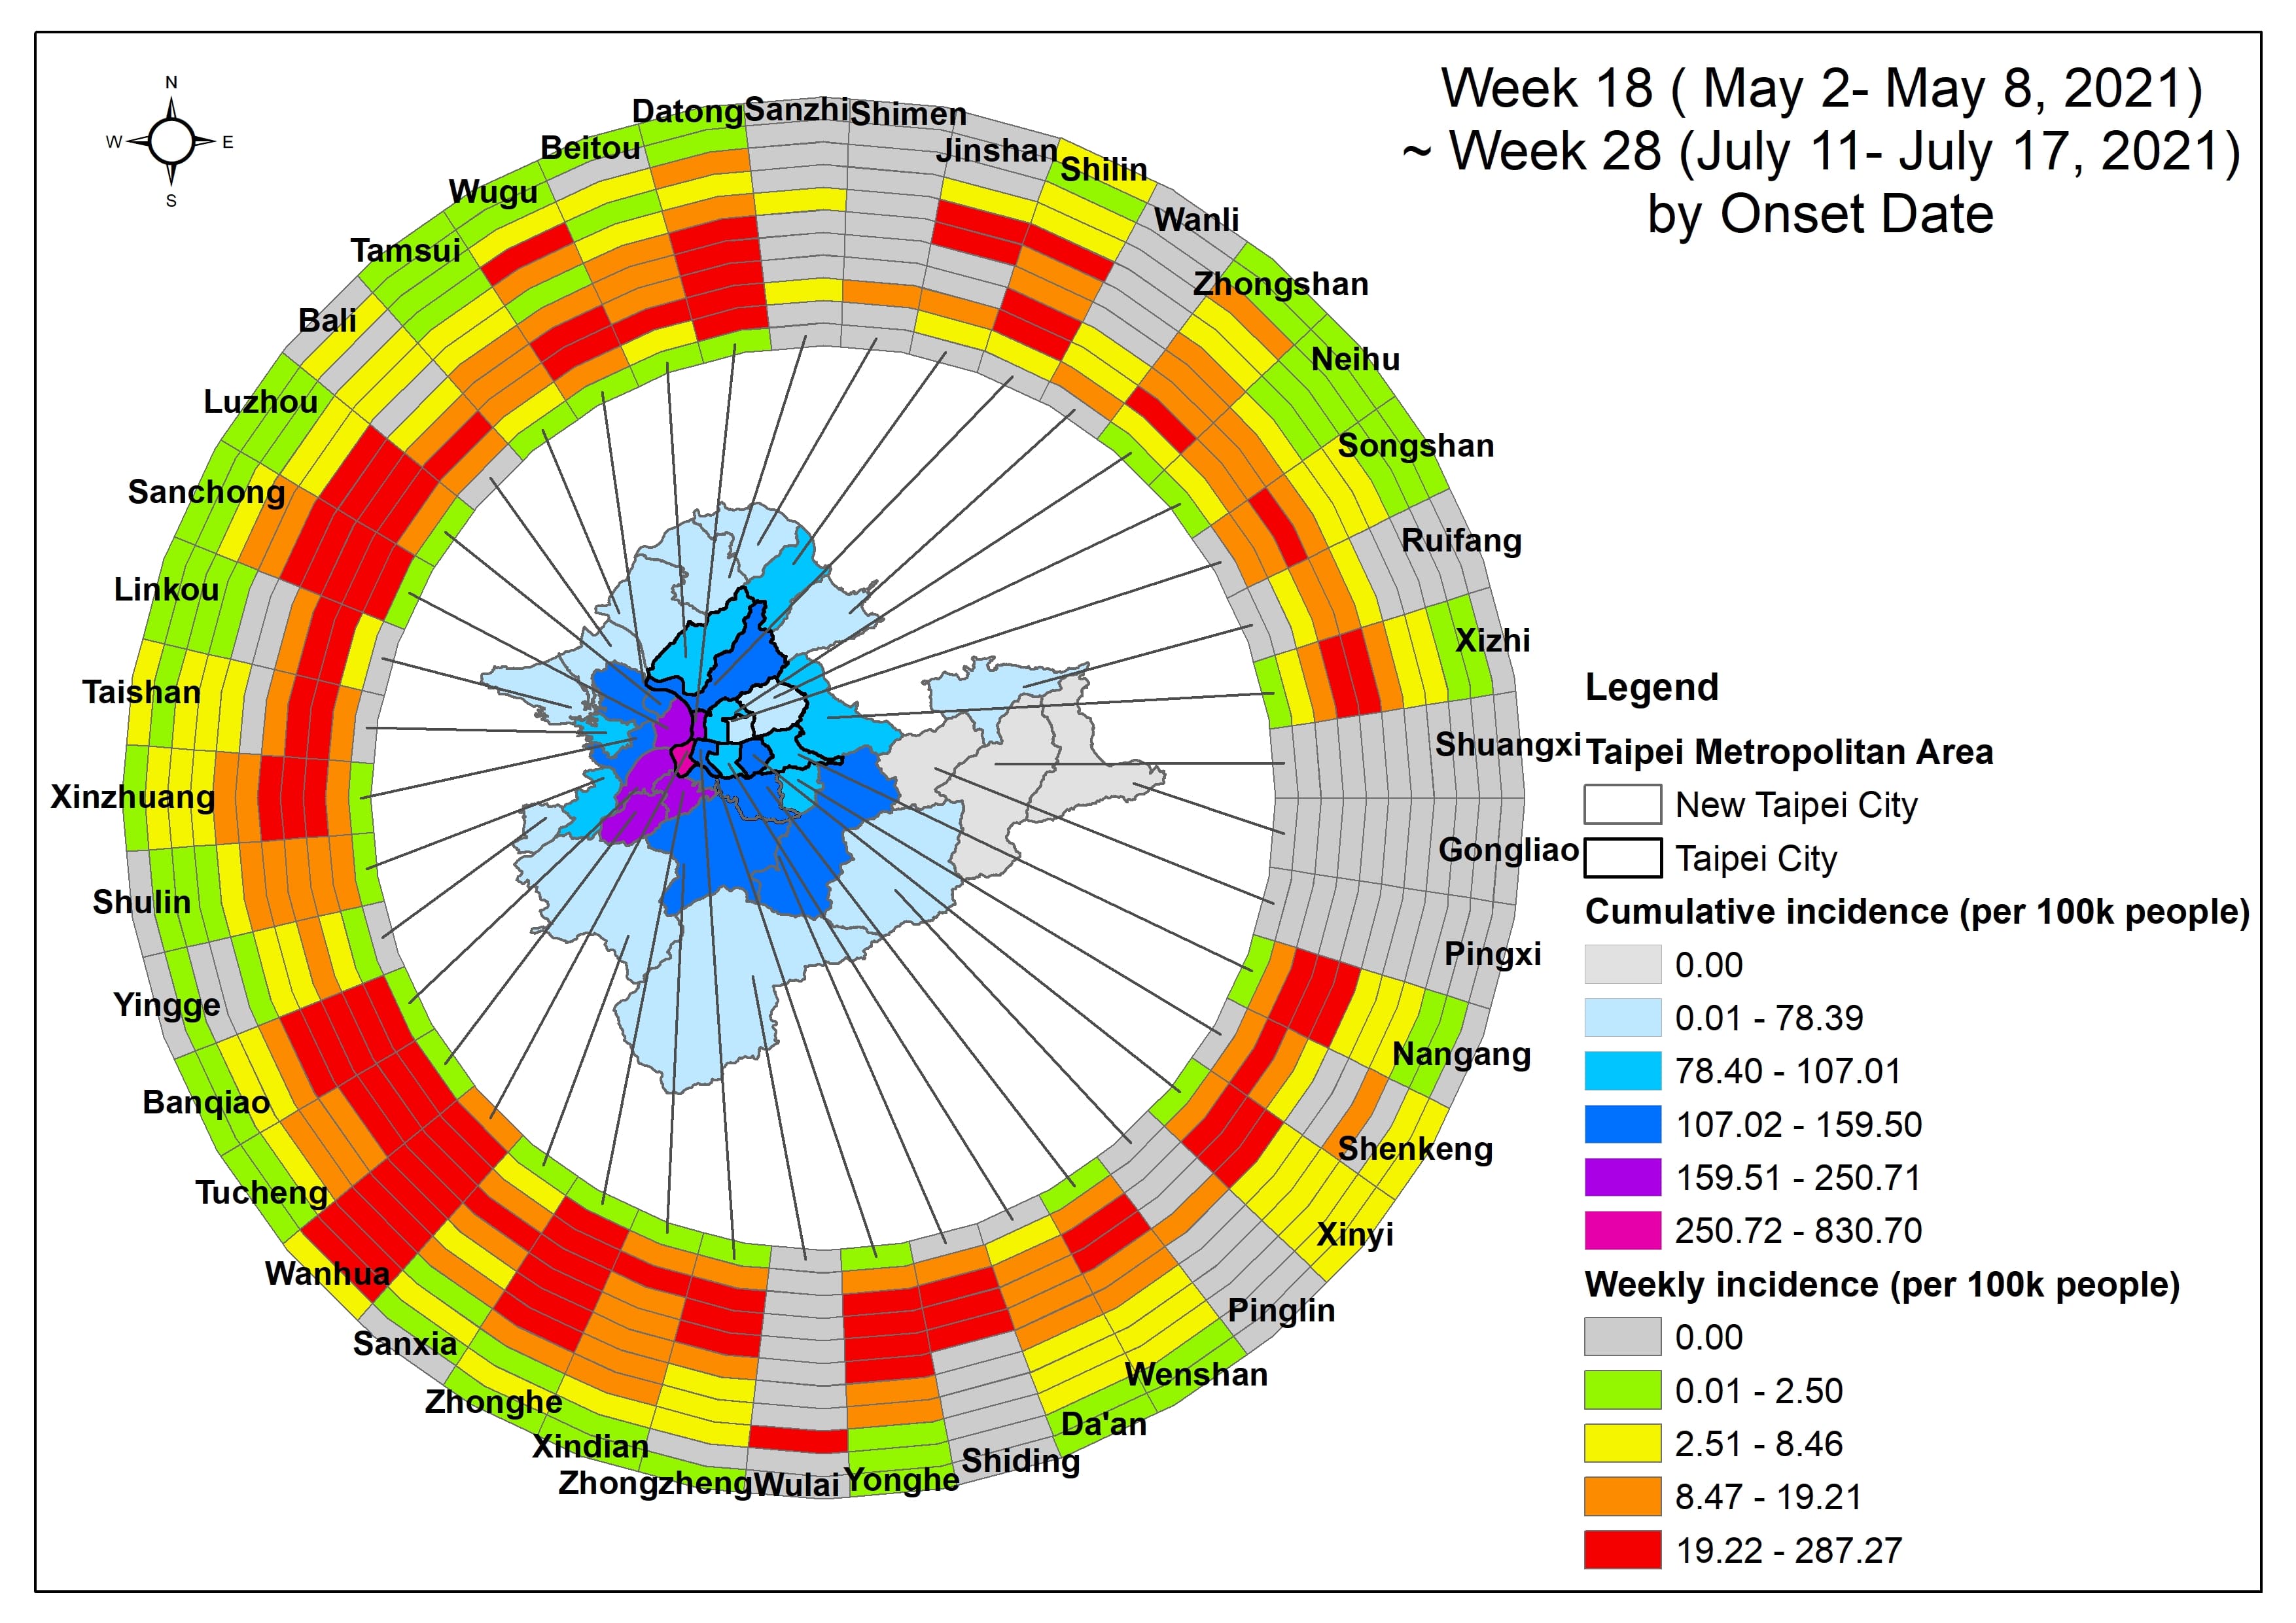
我們使用環形圖探索了 COVID-19 發病率的時空動態,在地圖中間,我們顯示了這 11 週內的累積發病率。在環形圖中,最內環是第18週(從2021年5月2日到5月8日),最外環是第28週(從2021年7月11日到7月17日),萬華在第18週較早出現高發生率疫情,周邊地區也有零星的訊號。而臺北市和新北市於5月15日,也就是第19週的最後一天(即第2環)發布了三級警戒。
We explored the spatiotemporal dynamics of COVID-19 incidence using a ring map. In the middle of the map, we show the cumulative incidence among these 11 weeks. In the ring map, the innermost ring is Week 18 (from May 2 to May 8, 2021), and the outermost ring is Week 28 (from July 11 to July 17, 2021). Wanhua had an earlier strong signal at Week 18 and the neighboring districts also had some sporadic signals. Taipei City and New Taipei City had level three alerts on May 15, the last day of Week 19 (i.e. second ring).